Opening a Company-Wide Conference to Every Business Unit: Measuring What Actually Worked
How an AI-paired engineering effort removed registration barriers across 3 business units and replaced an organizational blind spot with real-time analytics • UX@CVS 2026
UX@CVS is CVS Health's company-wide UX conference, bringing together designers, researchers, and content strategists across three distinct business suites: CVS, Aetna, and Caremark. While the event always featured great content, two structural problems quietly limited it for years: people outside the "home" business unit struggled through login gates, and the committee had zero structured data on whether sessions were actually landing. Instead of waiting for an assigned ticket, I stepped up on the planning committee to build a zero-login feedback web app and a real-time analytics dashboard that gave our leadership honest numbers on what worked.
1. The Problem: Fragmented Access & A Measurement Blind Spot
CVS Health spans three distinct business divisions: CVS Retail, Aetna, and Caremark. Each runs on its own accounts, access levels, and IT boundaries, which created two quiet but significant hurdles:
- Access was fragmented: Past conferences ran in a heavy "webinar mode" requiring separate registrations for every single session. If you were on an Aetna or Caremark laptop, getting through the login gates was frustrating, and registration consistently ranked as the #1 friction point in previous attendee surveys.
- There was no measurement: We had no structured way to capture session or conference feedback. Satisfaction, NPS, and engagement were purely anecdotal. The only attendance data came from raw Microsoft Teams logs, which overstated real session lengths by anywhere from 1.1x to 8.6x because people left calls open in the background.
2. My Role: Taking It on End to End
This wasn’t an assigned ticket. It was an obvious gap I saw on the planning committee and took on from problem framing to live operations:
- Ruthless scoping: I made the call to prioritize the access and measurement problem over a "nice-to-have" calendar/RSVP feature. What moved the needle wasn't polished superficial features, but answering: Can people get in, and did this conference actually work?
- AI-paired solo engineering: Working with Claude Code, I designed and built the entire system personally on CVS Health’s internal Cloud Application Platform (CAP), including the database, CI/CD pipeline, and live Slack integration. This enabled me to ship solo at a pace that typically requires a dedicated team.
- Live conference operations: During the three days of the conference, I ran live ops, caught and patched a webhook-formatting bug on day one via log analysis (not guesswork), and iterated on dashboard features in real time based on committee requests.
3. The Architecture: Zero Login, Open Surveys, and Live Dashboards
To make sure anyone could participate regardless of their hardware or business unit, I built the app around one core rule: zero login required.
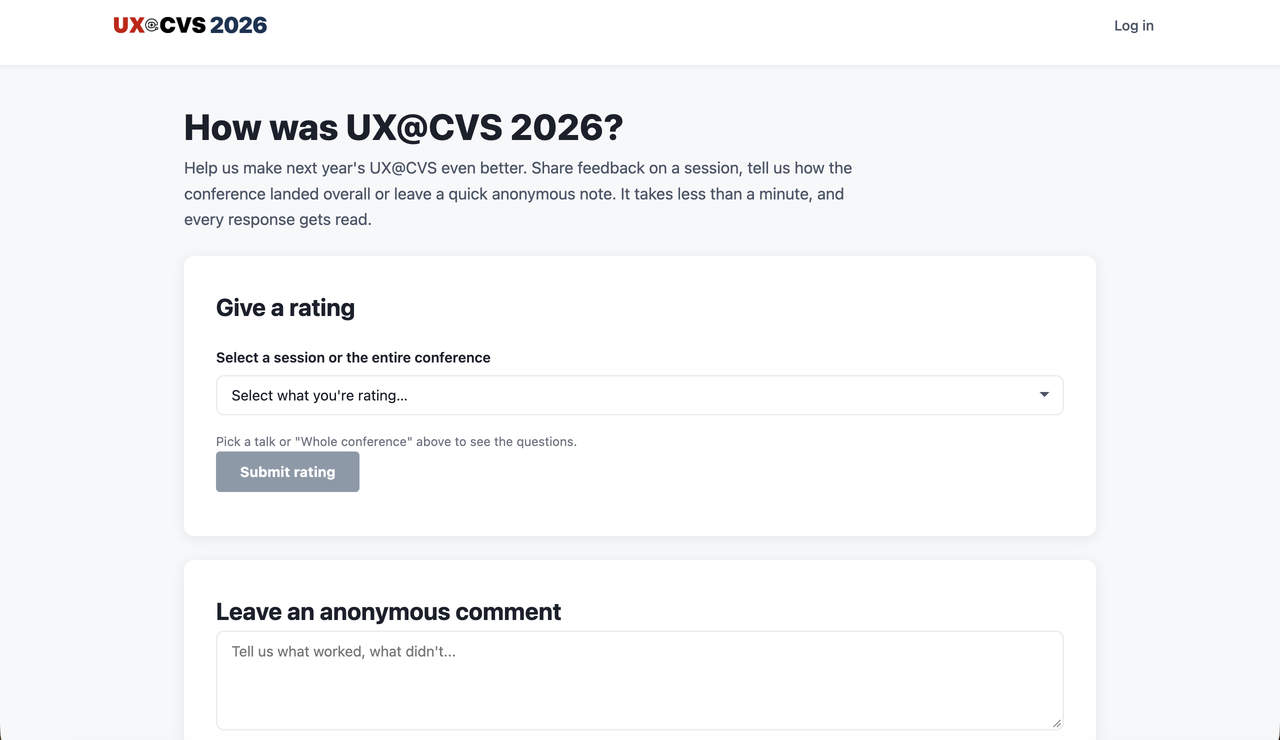

- No passwords or accounts: The feedback form was a public link. To protect privacy while preventing duplicate responses, we captured email once and hashed it into an anonymous token. No plain-text emails were ever stored in the database.
- One dynamic survey for the entire event: Instead of managing 20 different forms, a single survey handled every session. We added an automated URL lock for the closing keynote so a company-wide email could go out without attendees picking the wrong session from a dropdown.
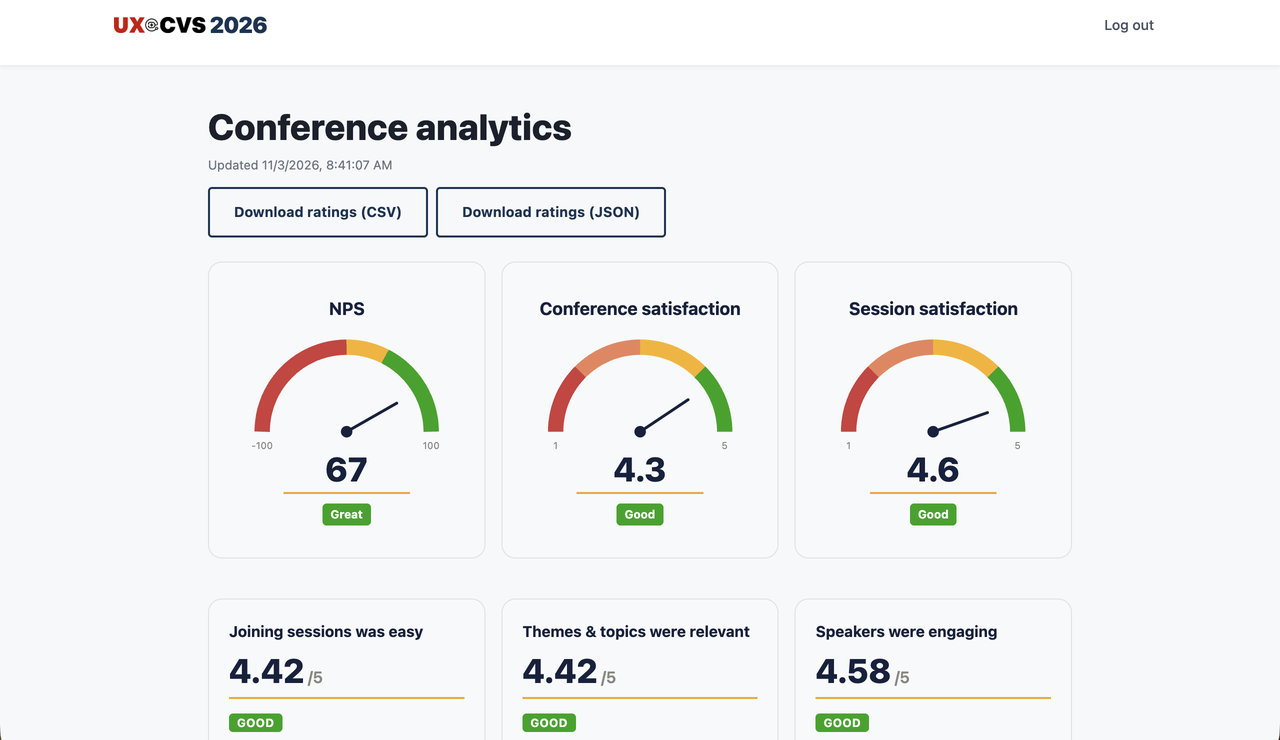
- Live leadership dashboard: A password-gated analytics dashboard provided the committee with live NPS gauges, session scores, and org breakdowns as responses rolled in.
4. Turning Unstructured Data into Committee Insights
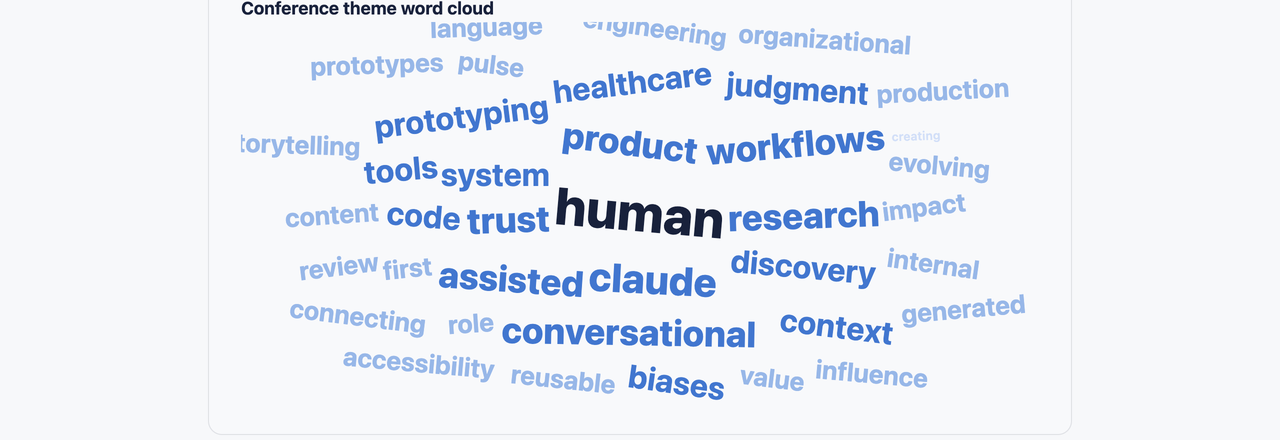
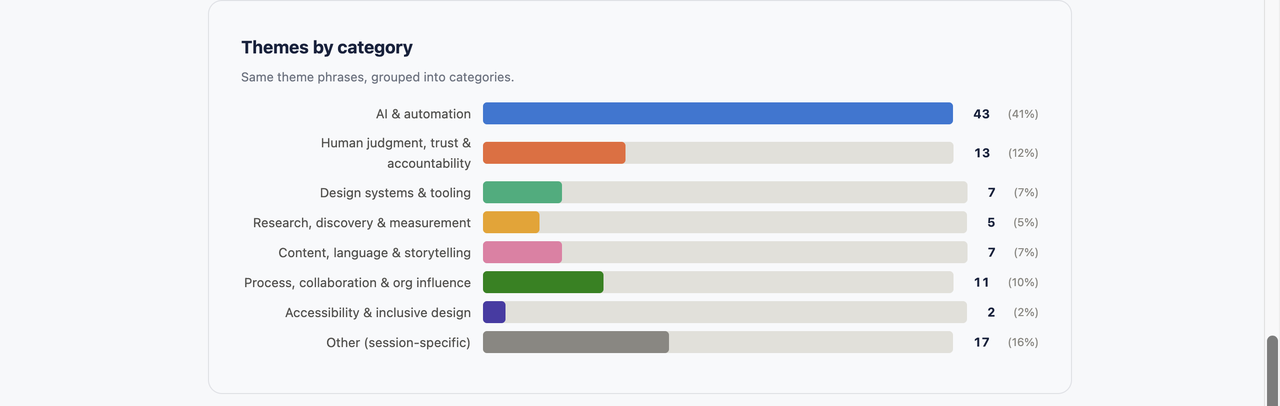
Numbers only tell part of the story. To understand what attendees were actually talking about across 21 sessions, I built an automated workflow to synthesize the Microsoft Copilot meeting transcripts:
The 8.6x Teams Data Catch
When we compared Copilot engagement recaps against raw Microsoft Teams logs, something stood out. Nearly every session's Teams call ran well past its scheduled end (one by as much as 8.6x) because people left calls open in the background. A naive calculation would have severely distorted attendance. By filtering out phantom overrun time, we reported average real attendance presence at 72.8% of scheduled time, giving leadership honest, credible metrics instead of vanity numbers.
The Results: Proof Across Every Division
The clearest proof that removing access barriers worked? We received structured, measurable feedback from every single business unit, not just the core team running the event:
Leadership Retrospective: Why This Matters Beyond the Conference
UX@CVS was opened this year by the EVP of Experience & Technology. Being trusted to design, build, and operate the infrastructure an event at this level ran on represents four key leadership principles:
- Volunteering over waiting: Spotting the access and measurement void and volunteering to solve it instead of waiting for an assigned ticket is what distinguishes a contributor from a committee leader.
- Plumbing is community: It’s easy to talk about cross-company collaboration, but if designers from sister business units can’t even join a meeting without IT headaches, community remains theoretical. True leadership fixes the operational plumbing that keeps teams apart.
- Honest data over vanity metrics: Catching the 8.6x Teams overrun and taking the time to report genuine attendance presence built real credibility with executive stakeholders.
- Lead by building: Design leaders shouldn't just facilitate meetings; being able to roll up your sleeves, leverage AI developer tooling, and ship working production software creates new organizational capabilities that didn't exist before.